Unprobed SeqFISH gene analysis
This notebook demonstrates imputation of unprobed genes for seqFISH ST dataset.
Input data can be downloaded from seqfish.tar.gz, please extract it with
tar -xzvf seqfish.tar.gz
and change the variable pre_datapath in the next cell accordingly.
[ ]:
import torch
import warnings
import pickle

import squidpy as sq
import numpy as np
import scanpy as sc
import pandas as pd

from matplotlib import pyplot as plt
import seaborn as sns
from transpa.util import expTransImp


warnings.filterwarnings('ignore')
pre_datapath = "../../output/preprocessed_dataset/seqFISH_single_cell.pkl"

seed = 10
device = torch.device("cuda:0") if torch.cuda.is_available() else torch.device("cpu")
Step 1. Load preprocessed SeqFISH and single-cell reference datasets.
Retrieve leiden clusters if uncertainty estimation is required
[2]:
with open(pre_datapath, 'rb') as infile:
    spa_adata, scrna_adata, raw_spatial_df, raw_scrna_df, raw_shared_gene = pickle.load(infile)
    cls_key = 'leiden'
    classes = scrna_adata.obs[cls_key]
    ct_list = np.unique(classes)
Step 2. Select genes from single cell reference data
2.1 Select top-1000 highly variable genes
[3]:
sc.pp.highly_variable_genes(scrna_adata, n_top_genes=1000)
scrna_adata
[3]:
AnnData object with n_obs × n_vars = 32844 × 29452
    obs: 'cell', 'barcode', 'sample', 'pool', 'stage', 'sequencing.batch', 'theiler', 'doub.density', 'doublet', 'cluster', 'cluster.sub', 'cluster.stage', 'cluster.theiler', 'stripped', 'celltype', 'colour', 'sizeFactor', 'leiden'
    var: 'ENSEMBL', 'SYMBOL', 'SymbolUniq', 'highly_variable', 'means', 'dispersions', 'dispersions_norm'
    uns: 'log1p', 'hvg'
2.2 Uniformly select 1000 more genes
Uniformly select 1000 more genes from single-cell reference, take union between highly-variable and random genes, and exclude probed 351 genes to retain the final unprobed genes
[4]:
test_genes = np.setdiff1d(scrna_adata.var_names[scrna_adata.var['highly_variable']], raw_shared_gene)
n_valid_hc_sc_genes = len(test_genes)
print(len(test_genes), " valid hv sc genes")
np.random.seed(42)
test_genes = np.setdiff1d(np.union1d(test_genes, np.random.choice(scrna_adata.var_names, 1000, replace=False)), raw_shared_gene)
len(test_genes)
802 valid hv sc genes
[4]:
1754
Step 3. Run TransImpLR with uncertainty score estimation
Run low-rank mode, raw cell as gene profile, and turn on uncertainty estimation with 200 local bootstrap samples.
[5]:
res = expTransImp(
        df_ref=raw_scrna_df,
        df_tgt=raw_spatial_df,
        train_gene=raw_shared_gene,
        test_gene=np.concatenate([raw_shared_gene, test_genes]),
        n_simulation=200,
        signature_mode='cell',
        mapping_mode='lowrank',
        classes=classes,
        n_epochs=2000,
        seed=seed,
        device=device)
[TransImp] Epoch: 2000/2000, loss: 0.781033, (IMP) 0.781033: 100%|██████████| 2000/2000 [00:32<00:00, 61.25it/s]
Step 4. Prepare adata object for imputation
[6]:
imp_adata = sc.AnnData(res[0])
imp_adata.var_names = np.concatenate([raw_shared_gene, test_genes])
imp_adata.obs = spa_adata.obs.copy()
imp_adata.obsm = spa_adata.obsm
imp_adata.obsp = spa_adata.obsp
Step 5. Compute spatial autocorrelation with Squidpy
[7]:
sq.gr.spatial_autocorr(
    imp_adata,
    n_jobs=10,
)
Step 6. Rank unprobed genes by uncertainty scores (sigmoid transformed)
[8]:
df_var = pd.DataFrame(res[1], index=np.concatenate([raw_shared_gene, test_genes]), columns=['pred_var'])
df_var.loc[test_genes].sort_values(axis=0, by='pred_var', ascending=True)
[8]:
| pred_var | |
|---|---|
| Rplp0 | 0.498482 |
| Rpl13 | 0.498531 |
| Rps27a | 0.498591 |
| Rps6 | 0.498615 |
| Rps14 | 0.498619 |
| ... | ... |
| Gm15290 | 0.500156 |
| Gm14344 | 0.500156 |
| Gm14243 | 0.500156 |
| Gm14174 | 0.500156 |
| Gm29129 | 0.500156 |
1754 rows × 1 columns
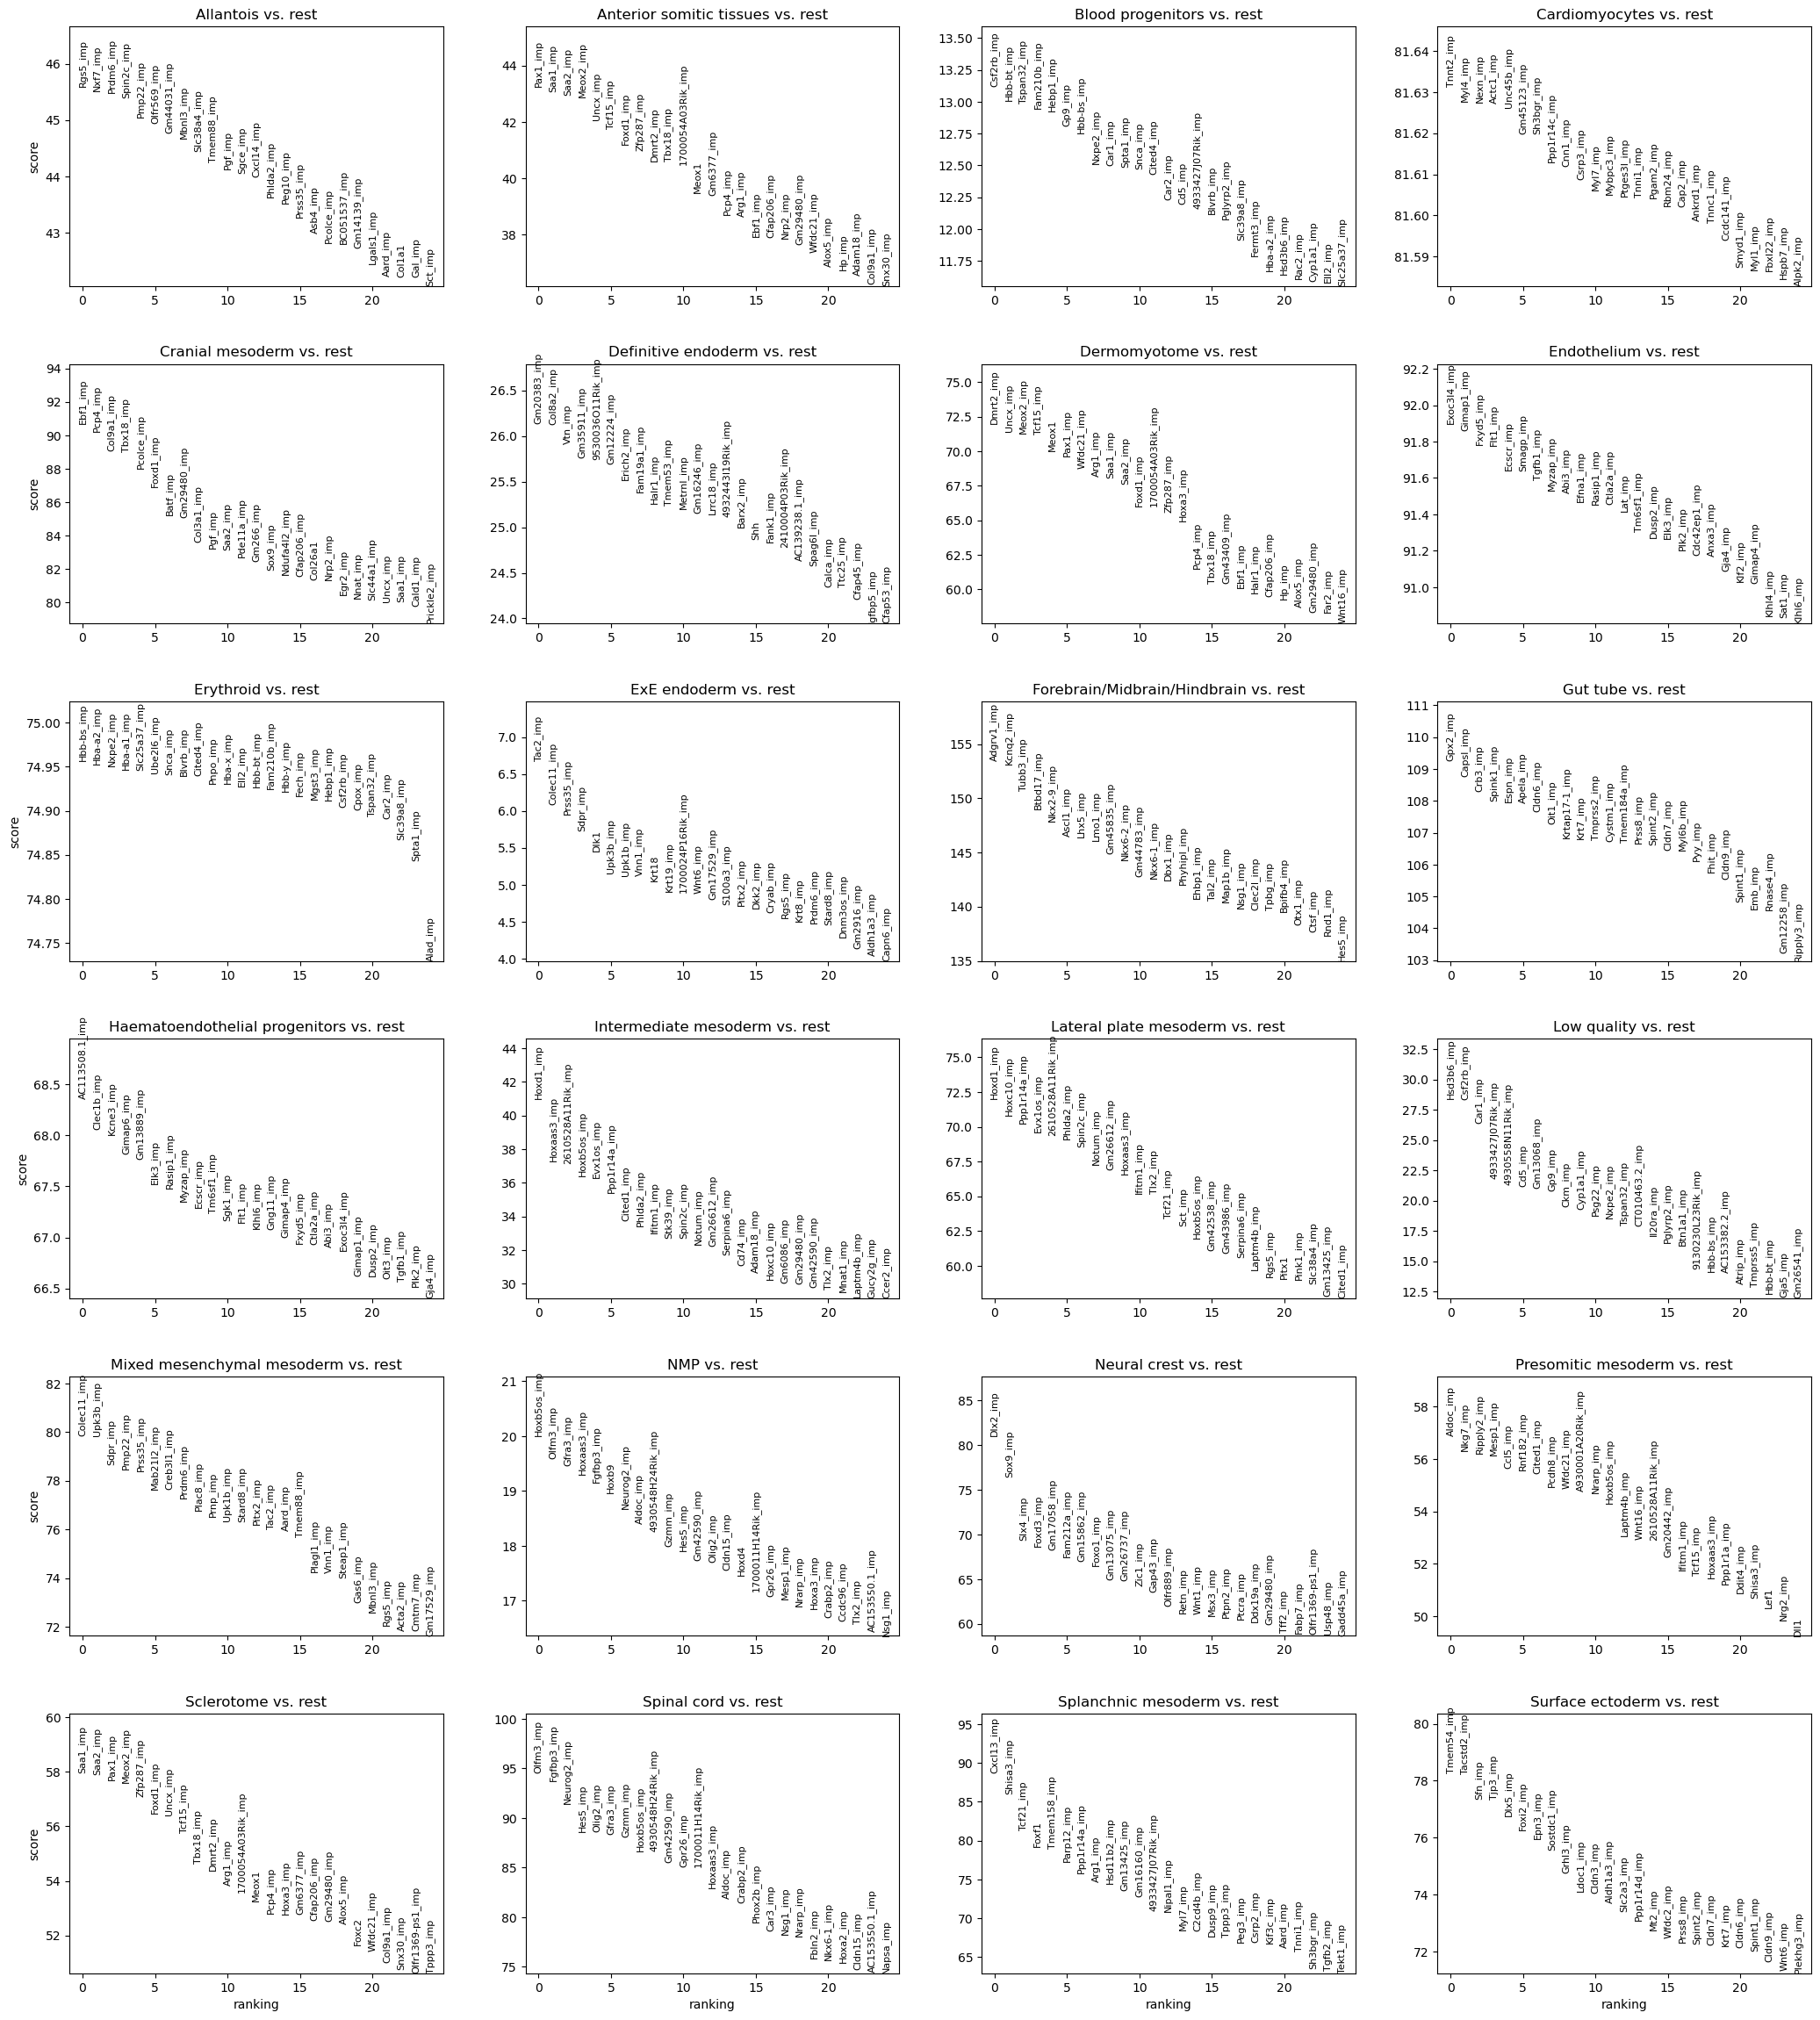
Step 7. Merge unprobed and observed probed genes and test cell type markers
Figures below show a lot of unrpbed genes (name with postfix “_imp”) are higher ranked markers
[9]:
merged_adata = sc.AnnData(np.hstack([res[0][:, len(raw_shared_gene):], spa_adata.X.toarray()]))
merged_adata.var_names = np.concatenate([[f'{g}_imp' for g in test_genes], spa_adata.var_names])
merged_adata.obs = spa_adata.obs.copy()
merged_adata.obsm = spa_adata.obsm
merged_adata.obsp = spa_adata.obsp
sq.gr.spatial_autocorr(
    merged_adata,
    n_jobs=10,
)
sc.tl.rank_genes_groups(merged_adata, 'celltype_mapped_refined', method='wilcoxon')
sc.pl.rank_genes_groups(merged_adata, n_genes=25, sharey=False)
[10]:
ratio_imp = []
for jth_ct in range(len(merged_adata.uns['rank_genes_groups']['names'][0])):
    imp_counter = 0
    for ith in range(25):
        # print(merged_adata.uns['rank_genes_groups']['names'][ith][jth_ct])
        # raise
        if merged_adata.uns['rank_genes_groups']['names'][ith][jth_ct].endswith("_imp"):
            imp_counter += 1
    ratio_imp.append(imp_counter / 25)
Step 8. Plot ratios of unprobed markers in each cell type
[11]:
sns.set(rc={'figure.figsize':(10,4), 'figure.dpi':100})

sns.barplot(x=pd.Series(np.unique(merged_adata.obs.celltype_mapped_refined), name='Cell type'), color='blue', y=pd.Series(ratio_imp, name="Ratio of Imputed Marker Genes"))
plt.xticks(rotation=45, ha='right', rotation_mode='anchor')
[11]:
(array([ 0,  1,  2,  3,  4,  5,  6,  7,  8,  9, 10, 11, 12, 13, 14, 15, 16,
        17, 18, 19, 20, 21, 22, 23]),
 [Text(0, 0, 'Allantois'),
  Text(1, 0, 'Anterior somitic tissues'),
  Text(2, 0, 'Blood progenitors'),
  Text(3, 0, 'Cardiomyocytes'),
  Text(4, 0, 'Cranial mesoderm'),
  Text(5, 0, 'Definitive endoderm'),
  Text(6, 0, 'Dermomyotome'),
  Text(7, 0, 'Endothelium'),
  Text(8, 0, 'Erythroid'),
  Text(9, 0, 'ExE endoderm'),
  Text(10, 0, 'Forebrain/Midbrain/Hindbrain'),
  Text(11, 0, 'Gut tube'),
  Text(12, 0, 'Haematoendothelial progenitors'),
  Text(13, 0, 'Intermediate mesoderm'),
  Text(14, 0, 'Lateral plate mesoderm'),
  Text(15, 0, 'Low quality'),
  Text(16, 0, 'Mixed mesenchymal mesoderm'),
  Text(17, 0, 'NMP'),
  Text(18, 0, 'Neural crest'),
  Text(19, 0, 'Presomitic mesoderm'),
  Text(20, 0, 'Sclerotome'),
  Text(21, 0, 'Spinal cord'),
  Text(22, 0, 'Splanchnic mesoderm'),
  Text(23, 0, 'Surface ectoderm')])

[12]:
def plot(genes, spa_adata, n_cols=5, figsize=(20, 20), dpi=100):
    genes = list(set(list(genes)))
    sns.set(rc={'figure.figsize':figsize, 'figure.dpi': dpi})
    plt.rcParams.update({"font.size":30, 'axes.titlesize':30})
    pre_exprs = [spa_adata[:, gene].X.toarray().flatten() for gene in set(list(genes))]
    exprs = []
    for expr in pre_exprs:
        qt = np.quantile(expr, 0.1)
        expr[expr < qt] = qt
        # qt = np.quantile(expr, 0.85)
        # expr[expr > qt] = qt
        exprs.append(expr)
    titles = [f"{gene}\n M.I. {spa_adata.uns['moranI'].loc[gene].I:.3f}" for gene in genes]
    # sc.pl.spatial(spa_adata, color=[gene], spot_size=0.1, title='Truth')


    tmp_adata = sc.AnnData(np.array(exprs).T)
    print(tmp_adata)
    tmp_adata.var_names = titles
    tmp_adata.obsm['spatial'] = spa_adata.obsm['spatial'].copy()
    sc.pl.spatial(tmp_adata, color=titles, spot_size=0.1, title=titles, color_map='OrRd', legend_fontsize=10, wspace=0.00001, hspace=0.5, ncols=n_cols)
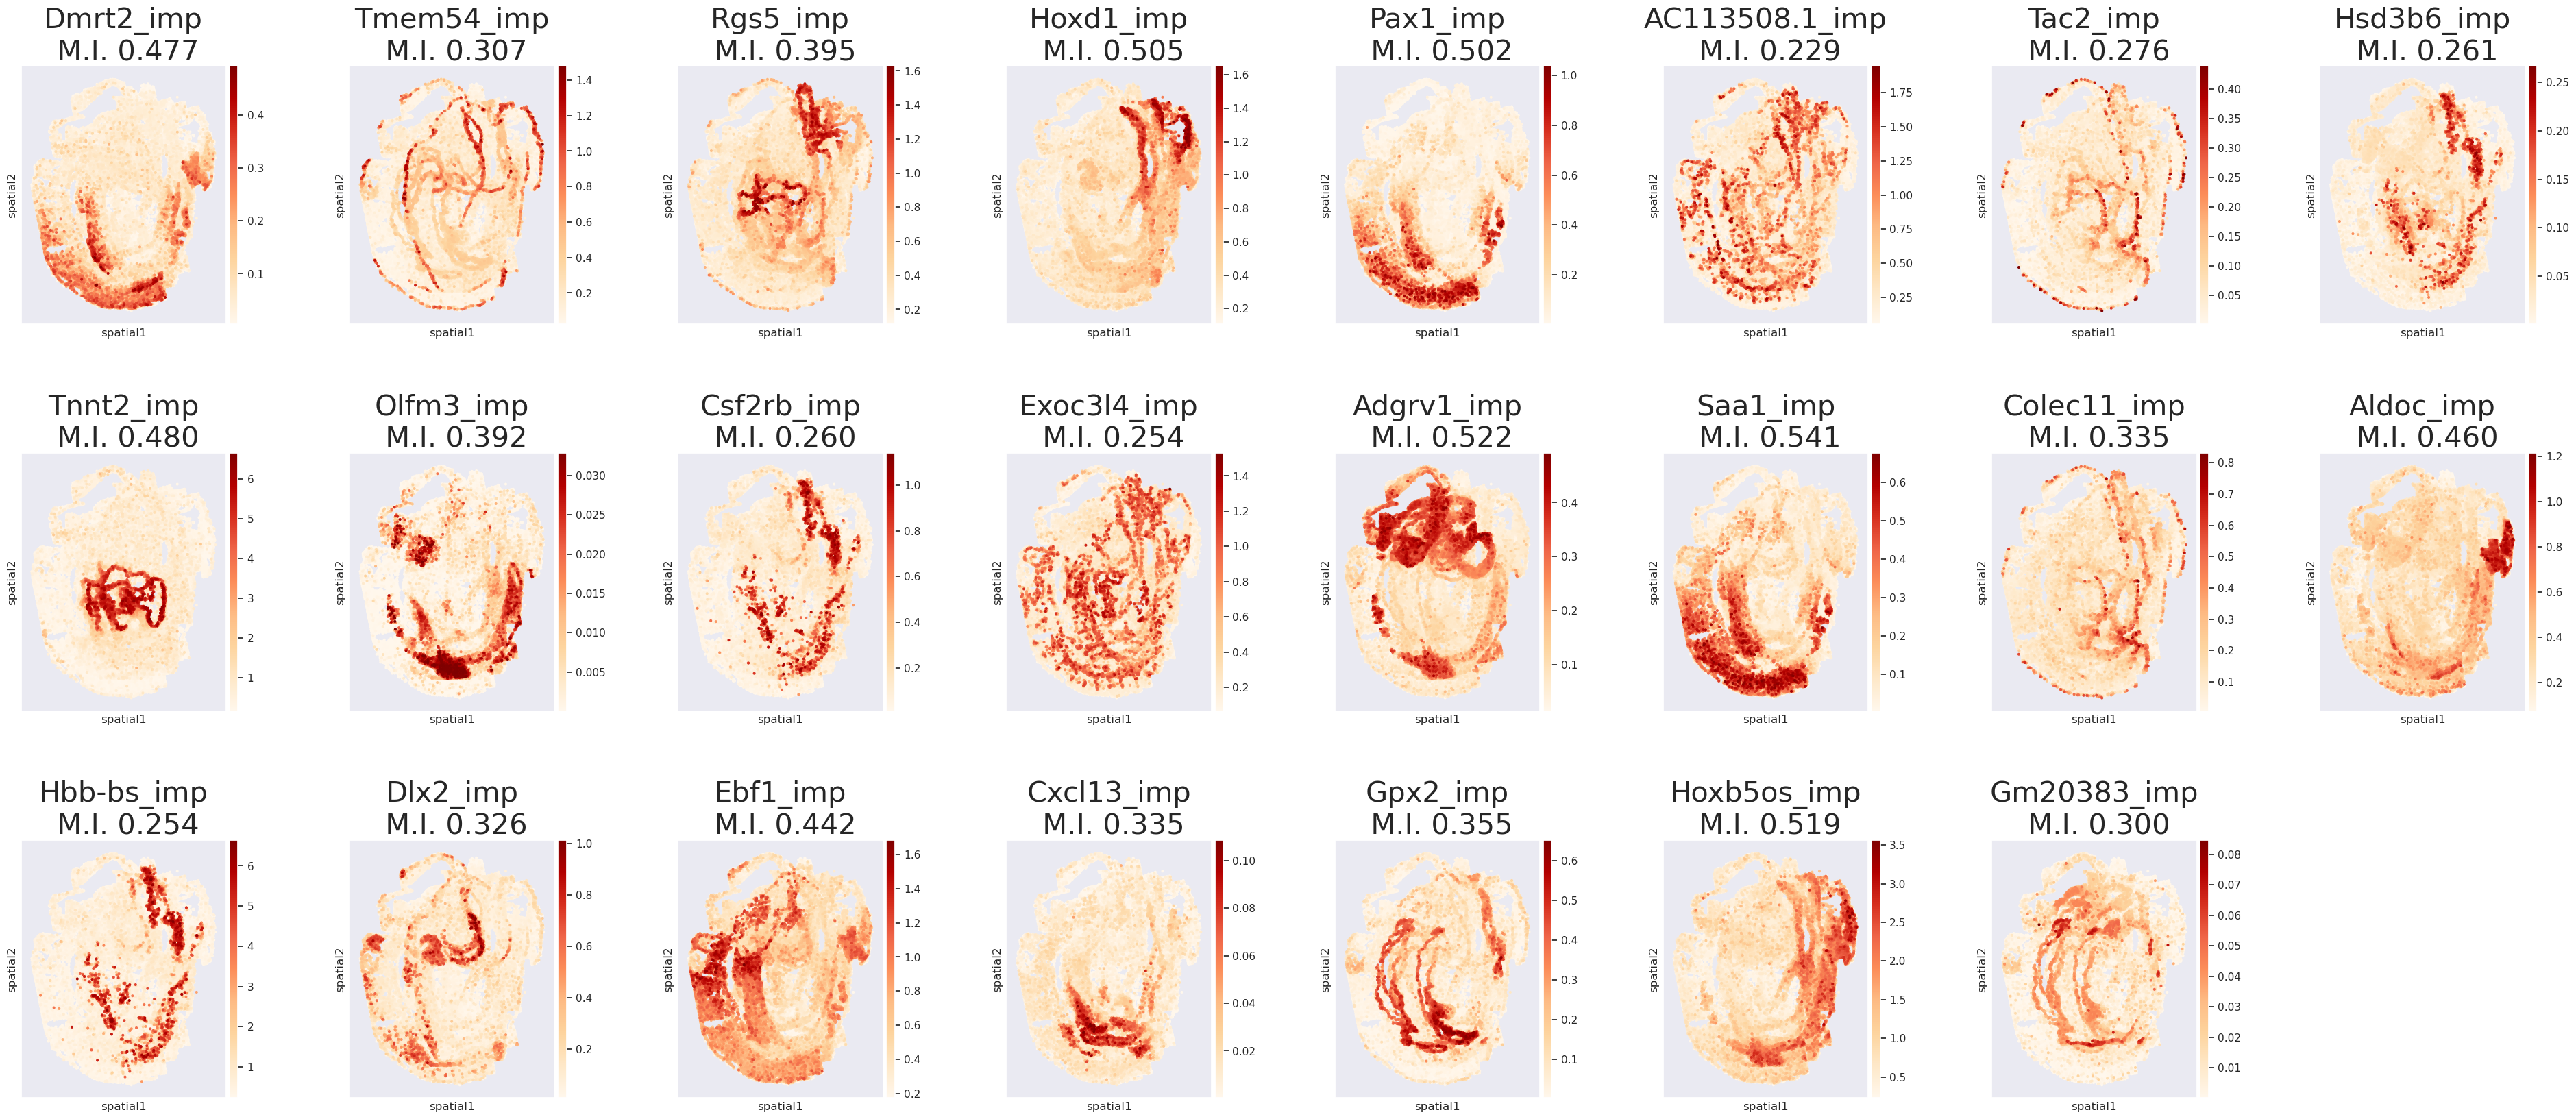
Step 9. Plot the top-1 markers in each cell type
Postfix “_imp” indicates unprobed genes
[13]:
plot(list(merged_adata.uns['rank_genes_groups']['names'][0]), merged_adata, n_cols=8, figsize=(6,6), dpi=100)
AnnData object with n_obs × n_vars = 57536 × 23
[ ]: